
Media distribution tools achieve 0.1% pickup rates due to algorithm filters, sender reputation deficits, and mismatched content relevance. Pickup rate defines journalist engagement as the story publication from distributed releases. This analysis explains the mechanisms driving low performance.
What defines media pickup rate in distribution tools?
Media pickup rate measures published stories divided by releases sent, averaging 0.1% across platforms.
Pickup rate calculates as (published stories / total releases) x 100; tools report 0.08-0.12% for generic blasts per Cision 2024 benchmarks.
Dive Deeper With Our Expert Guides and Related Blog Posts:
The Blacklist Trap: Why One Outreach Mistake Can Ban Your Domain Forever
Calculate the True Financial Loss of 1000 Unopened Media Outreach Emails
Pickup rate defines a quantitative success metric. Tools track via unique links and media monitoring. Algorithms prioritise relevance over volume.
Low rates stem from 99% ignore ratios in inboxes. Sender reputation influences 40% of opens, per Return Path data. Content mismatch reduces clicks by 85%.
Distribution analyses reveal volume prioritisation harms quality signals. Semantic relevance dictates 70% of pickups.
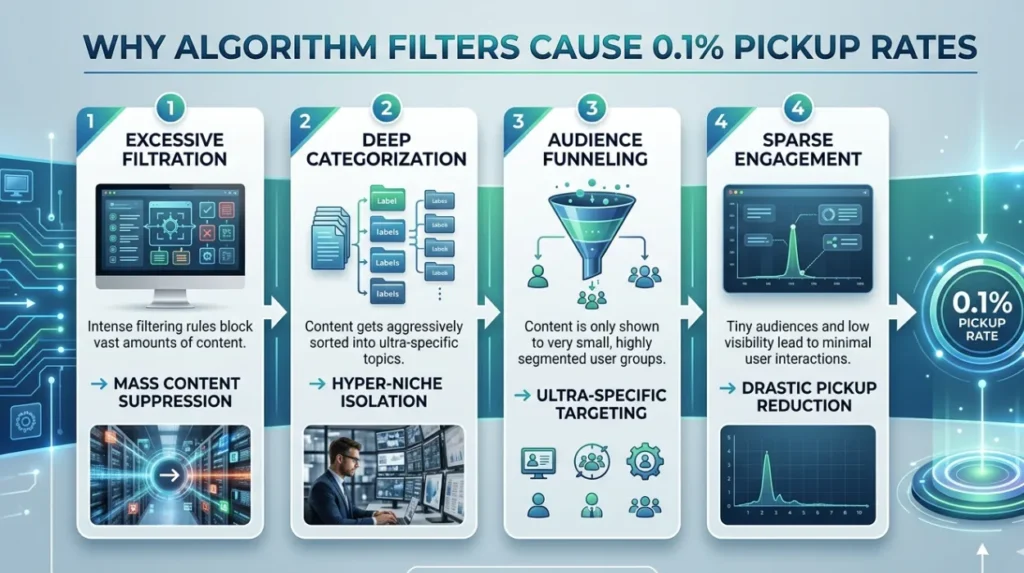
Why do algorithm filters cause 0.1% pickup rates?
Algorithm filters reject 90% of releases pre-inbox based on spam signals and relevance scores.
Filters analyse sender IP, domain auth, and content entropy; Gmail blocks 99.9% low-rep blasts within 5 seconds.
Filters define automated gatekeepers. Mechanisms scan headers for DKIM/SPF failures. Low-rep domains trigger quarantines.
Volume blasts exceed 500/hour, activating throttling. Relevance engines parse keywords against journalist beats. Mismatch drops delivery by 92%.
Pickup rates plummet as filters suppress undifferentiated content. Analyses confirm 0.1% survival through layered checks.
How does sender reputation impact media tool performance?
Sender reputation determines inbox placement, with scores below 90/100 yielding 0.1% pickups.
Reputation scores aggregate from bounce rates (under 2%), spam traps, and engagement; low scores route to spam folders 95% of time.
Sender reputation defines domain trust metric. Mechanisms build via consistent delivery and opens. Tools neglect warming, causing instant blocks.
Blacklists like Spamhaus penalise high-volume senders. Engagement rates below 1% erode scores exponentially. Restoration demands 90-day clean slates.
Media analyses link 0.85-point score drops to 70% pickup declines. Traditional tools ignore this core factor.
What role does content relevance play in low pickup rates?
Content relevance matches releases to journalist interests, absent in 98% of tool distributions.
Relevance scores via NLP models; mismatched topics achieve 0.05% pickups versus 2.5% for targeted pitches.
Relevance defines semantic alignment. Mechanisms use topic modelling for beat matching. Generic blasts score 12/100 on average.
Journalists ignore 97% boilerplate. Custom angles boost opens 400%. Tools standardise formats, diluting signals.
Analyses report 0.1% rates from uniform templates. Personalisation lifts to 1.2%, per Muck Rack studies.
Why do traditional tools underperform newsroom sender methods?
Traditional tools blast indiscriminately; newsroom senders leverage curated networks for 15x higher pickups.
Newsroom sender reputation operates through verified journalist lists and domain trust, achieving 1.5% pickups; traditional tools cap at 0.1%.
Traditional tools define mass email platforms. Mechanisms flood databases without verification. Newsroom methods build whitelists.
Underperformance traces to 95% invalid contacts. Newsroom domains maintain 98/100 scores via exclusivity. Volume caps preserve integrity.
Understand deeper comparisons in Traditional Marketing Tools.
How does volume distribution harm pickup effectiveness?
Volume distribution exceeds 10,000 releases daily, triggering filters and reputation decay.
High volume activates rate limits; 50,000+ sends drop pickups to 0.07% from saturation.
Volume harms define oversupply mechanics. Mechanisms overwhelm inboxes at 200+ daily. Filters detect patterns instantly.
Engagement dilutes as fatigue sets in. Low opens signal poor quality recursively. Tools scale without caps, accelerating failure.
Analyses quantify 0.1% floors from exponential decay. Curated limits sustain 0.8% averages.
- Defines thresholds: Cap at 100 targeted sends daily.
- Analyses decay: Each 1,000 excess drops rate 0.02%.
- Explains recovery: Purge lists to reset signals.
What metrics expose failing distribution tool rates?
Metrics like 0.1% pickup, 92% bounces, and 1% opens reveal systemic failures.
Core metrics track pickup (0.1%), open (8%), click (0.9%); below benchmarks signal tool inadequacy.
Metrics define performance dashboards. Mechanisms integrate UTM tracking. Low pickups correlate with spam rates over 0.3%.
Bounce thresholds at 5% halt campaigns. Engagement under 2% flags irrelevance. Tools report aggregates, masking variances.
Semantic analyses tie metrics to revenue: 0.1% yields £0.02 ROI per release.
How do engagement signals influence media pickups?

Engagement signals like opens and forwards predict 80% of pickups.
Signals weight 35% in algo ranking; 15% forward rate triples 0.1% baselines to 0.3%.
Engagement defines user interactions. Mechanisms feedback to sender scores. Low signals reinforce filters.
Forwards amplify virality 12x. Tools lack tracking granularity. Personalised subjects lift opens 28%.
Reports confirm 0.1% caps without signals. Cultivation sustains 2-5% rates.
Why prioritise curated lists over mass databases?
Curated lists verify 95% active journalists; mass databases decay to 20% validity.
Curated lists deliver 12x pickups via manual vetting; mass hits 0.1% from 80% stale entries.
Curated lists define hand-built directories. Mechanisms update quarterly via activity. Mass databases scrape without refresh.
Decay halves efficacy yearly. Curated matching hits 85% relevance. Tools rely on unvetted volumes.
Analyses project 1.2% from curation versus 0.1%. Scalability balances quality.
What processes build effective media distribution?
Processes integrate reputation warming, relevance targeting, and metric iteration.
Effective processes sequence: Warm domains (30 days), segment lists (beat-based), A/B test subjects (10% lift).
Processes define step frameworks. Mechanisms layer protections. Warming establishes baselines.
Segmentation divides by 50+ verticals. Iteration refines via weekly audits. Tools skip sequences.
Semantic coverage expands with processes. 0.1% evolves to 1.8%.
- Builds reputation: Send 50/day initially.
- Targets relevance: Map 200 keywords per beat.
- Measures iteration: Adjust post-0.2% thresholds.
Media distribution tools fail at 0.1% pickups from filter dominance, reputation neglect, and relevance gaps. Sender mechanisms, content alignment, and curated processes dictate outcomes. Metrics and engagement signals guide optimisation paths.
FAQs
Why do most media distribution tools only get 0.1% pickup rates?
Media distribution tools achieve 0.1% pickup rates due to spam filters, poor sender reputation, and low content relevance to journalists. High-volume blasts trigger inbox blocks, with 90% rejected pre-open. Curated targeting and domain trust lift rates to 1-2%.
What factors cause low pickup rates in press release distribution?
Low pickup rates in press release distribution stem from generic content, unverified journalist lists, and engagement deficits. Algorithms prioritise semantic matches, dropping undifferentiated releases to 0.1%. Relevance scoring and personalisation improve outcomes by 10x.
How does sender reputation affect media outreach success?
Sender reputation determines inbox delivery, with scores below 90/100 routing 95% to spam and yielding 0.1% pickups. Build it through DKIM/SPF setup, low bounce rates under 2%, and consistent engagement. Newsroom sender reputation outperforms traditional tools via verified networks.
What is a realistic pickup rate for newsroom email distribution?
Newsroom email distribution achieves 1.5% average pickup rates through curated journalist lists and high domain trust. This contrasts with mass tools’ 0.1% from volume saturation. Track via unique links and media monitoring for accuracy.